What are morning and evening star candlestick patterns?
Table of Contents
- What is the Morning Star candlestick pattern?
- What is the Evening Star candlestick pattern?
- Why are Morning & Evening Star formations important?
- Trading with star patterns
Stock traders monitor several visual chart patterns to analyse the potential lucrativeness of a trade. Morning and evening star candlestick patterns happen to be two of the most common pattern indicators preferred by traders. Lets’s take a closer look at how they can help.
What is the Morning Star candlestick pattern?
The morning star is a pattern that contains three candlesticks. Technical analysts interpret it as a bullish sign. The thing that makes this star different from others is that it often forms after a downward trend and indicates the beginning of an upwards climb. Morning candlestick pattern signifies reversal signs from the recent price trend.
Traders are always on the lookout for a morning star formation and once it starts to form on the chart, they seek confirmation using other indicators to determine whether or not an upcoming reversal is likely.
What is the Evening Star candlestick pattern?
The evening star candlestick pattern is used by technical analysts to see if there is a reversal on the horizon. Unlike the morning star pattern, the evening one is bullish and has three candles, the first being a large bullish candle, followed by a small bodied candle and finally a large bearish one.
Experts often associate the evening star pattern with an uptrend’s peak price, which signifies that the uptrend is about to end.
Why are Morning & Evening Star formations important?
As discussed earlier, stock trading experts utilise morning star patterns as visual signs for the beginning of trend reversals. However, their importance increases tenfold once other indicators start backing them up.
The volume that contributes to the pattern is a critical indicator of the pattern's strength. A trader is mostly searching for a volume increase in all three candles that form the pattern. If the third has high volume, technical analysts see it as a confirmation sign, even if other indicators hint otherwise. Traders may take up bullish positions on a pair/commodity/stock etc. as the pattern forms during the third session, and they ride this uptrend until they find signs of another reversal.
Analysts consider the evening star pattern to be an excellent indicator of future price decline. The candlestick pattern does not form instantly and often takes three periods (candles) to complete. There is a sizeable bullish candle on the first period that signifies a continuous rise in the prices. The candle on the second period is slightly smaller, and it highlights a modest increase while the large bearish candle on the third period shows price openings lower than the previous, ending close to the middle of the initial candle.
Trading with star patterns
If you look at the morning star pattern in the chart below, you can see that it shows a clear downtrend that leads to the reversal pattern’s formation.
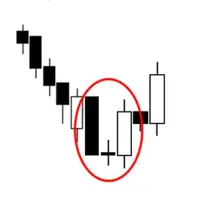
As soon as the formation is complete, traders can consider entering the market during the next candle’s opening. On the other hand, conservative traders could postpone their entries to see whether or not the price action will move higher. The drawback of this process is that traders could unknowingly enter at worse levels, particularly in fast moving markets.
Traders can place targets at previous resistance levels or consolidation areas. It is also possible to place them below new swing lows, as breaks of this magnitude will negate the reversal.

world’s #1 broker
awards